

01. Introduction: Dropouts Are a Planning Problem, Not an Equipment Problem
The most glaring failure at a live show is rarely a blown loudspeaker or a frozen console — it is the host's microphone going silent at the stage edge, with a few hundred people watching and no way to recover.
Most teams react by buying more expensive gear. Industry experience points the other way: the vast majority of dropouts, noise and intermodulation accidents trace not to equipment class but to missing frequency planning and antenna systems. A mid-tier system with a full spectrum survey and intermodulation math can out-stabilize a plug-and-play flagship.
This article gives the complete engineering method from planning to delivery: read the band, do the intermodulation math, match the antenna architecture, and walk the five-step process. One goal — turn dropouts from a matter of luck into a matter of engineering.
02. Read the Band: UHF Is Not Empty Land, It Is a Crowded Road
The main battlefield for professional wireless microphones in China is the UHF band (roughly 470–700 MHz). This spectrum is not idle: digital TV, mobile base stations and two-way radio all occupy lanes, and occupancy differs completely by city — a frequency clean in city A may sit right on top of a TV transmitter in city B.
| Occupancy Source | Typical Behavior | Countermeasure |
|---|---|---|
| Digital TV channels | Strong wideband signal, fixed occupancy | Avoid the whole segment; never force through |
| Mobile base stations | Raised noise floor at band edges | Keep guard bands; raise receive antennas |
| LED walls / digital gear | Wideband impulse noise, strong at close range | Keep antennas away from walls; shorten feeders |
| Other wireless systems | Multiple systems colliding on site | Coordinate centrally; share one frequency plan |
Conclusion: the first step of frequency planning is always an on-site spectrum survey, not the frequency table in the manual. Factory default groups are clean in the lab; in your venue, perhaps not.
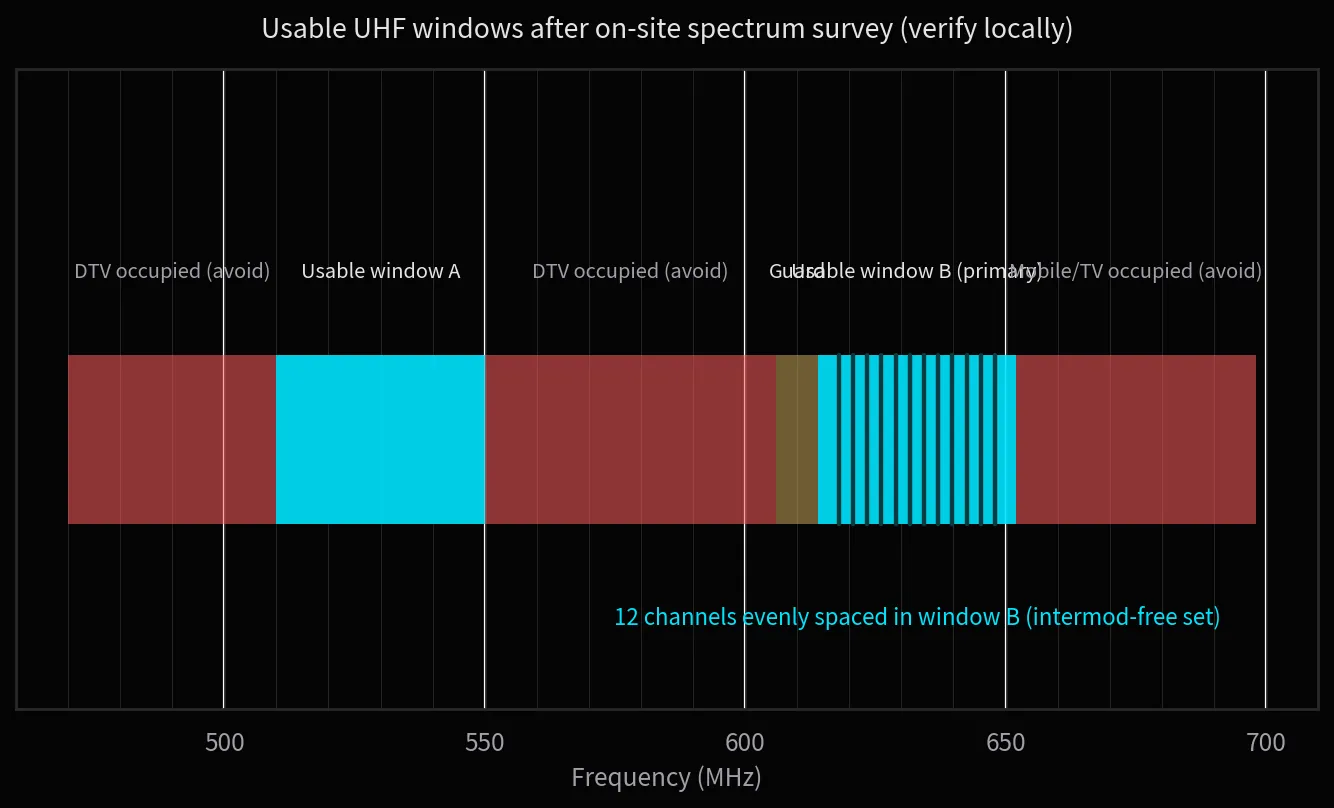
Figure 1
On-site UHF survey: usable windows exist only between TV and telecom occupancy; frequencies must be placed precisely inside the windows.
03. Do the Intermodulation Math: Even Spacing Is Not Safety
The core enemy of frequency coordination is intermodulation distortion. When two carriers enter a nonlinear device in a receiver or active antenna, they create new combination frequencies — the third-order products 2F1−F2 and 2F2−F1 land exactly on neighboring channels and contaminate clean ones.
That is why the intuitive "equal spacing" layout inevitably fails: even spacing makes intermodulation products fall neatly onto other in-use channels. Combinations grow quadratically with channel count — 8 channels produce 28 second-order pairs, 16 channels produce 120, far beyond hand calculation.
There is only one engineering practice: use coordination software (or the receiver's built-in scan-and-recommend) to compute a set of intermodulation-clean frequencies, then write them into each transmitter. Precomputed groups from one brand and series are safe internally, but mixing brands or overlaying existing TV channels requires recomputation.
An often-ignored multiplier is transmit power. Intermodulation strength rises with power — use 10 mW where 50 mW is not needed: save the power margin for distance, not for interference.
04. Match the Antennas: Coverage Beats Power
The antenna system is the most underestimated part of wireless microphones. With the same receivers, one tier down in antenna architecture costs an order of magnitude in usable radius and stability. Architecture should be tiered by channel count:
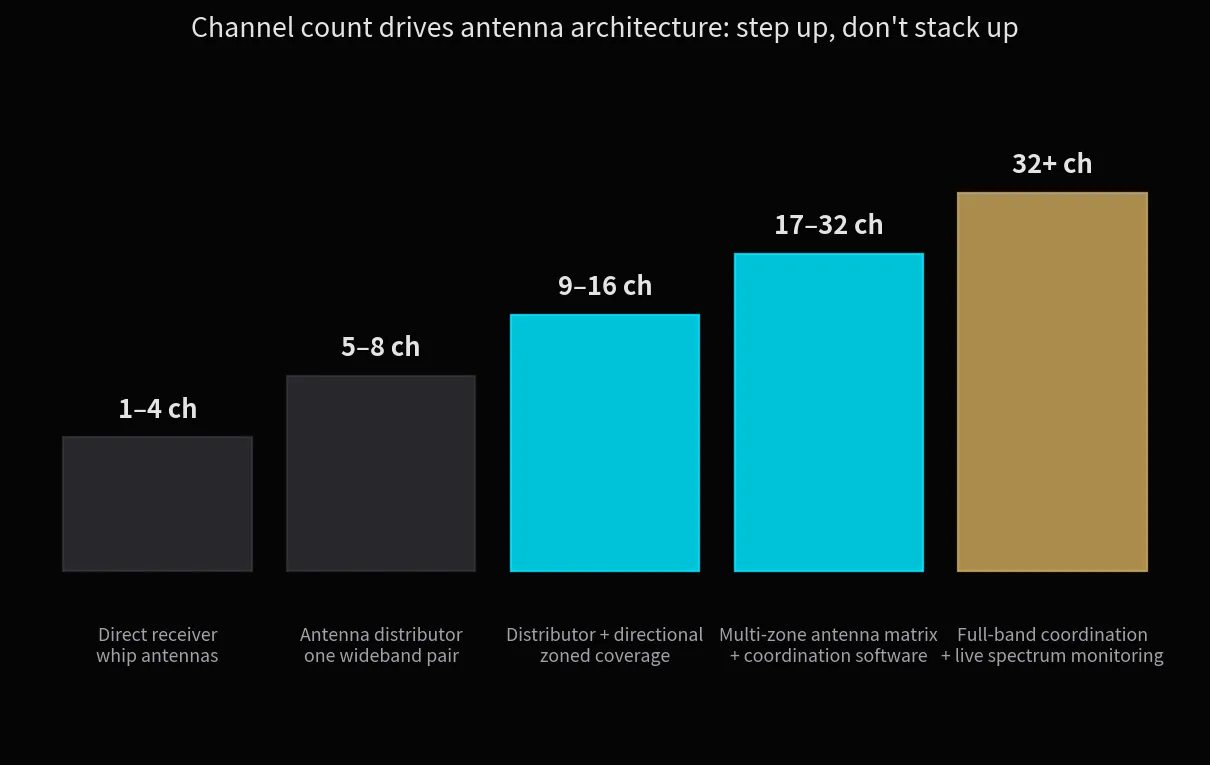
Figure 2
Channel count versus antenna architecture: upgrading the tier beats stacking more gear within a tier.
Three iron rules: ① keep antennas close to the performance area — the first mile of the link is over the air, and shortening it beats raising transmit power; ② account for feeder loss — 50 m of ordinary coax at 600 MHz can eat the entire system margin, so long runs need low-loss cable or inline amplifiers; ③ never hide antennas in rack rooms or metal cabinets — line of sight is the bottom line.
Multi-zone venues (main hall + function rooms + outdoor) must not gamble on one shared antenna. Build a per-zone antenna matrix feeding a common distribution system, and monitor each zone independently.
05. The Delivery Process: Five Steps Before It Counts
Turn the previous four chapters into an executable delivery process, each step with a defined artifact:
① Spectrum survey: scan within 48 hours before the show, log occupancy and noise floor — output: spectrum snapshot.
② Frequency coordination: software-computed clean frequencies — output: assignment table including backups.
③ Antenna placement: position antennas per zone plan, verify feeder loss — output: antenna layout drawing.
④ Gain and rehearsal: minimize transmit power, verify gain structure stage by stage, walk-test every channel.
⑤ Show patrol: rescan before curtain, spare units and spare frequencies on standby, monitor RF levels live.
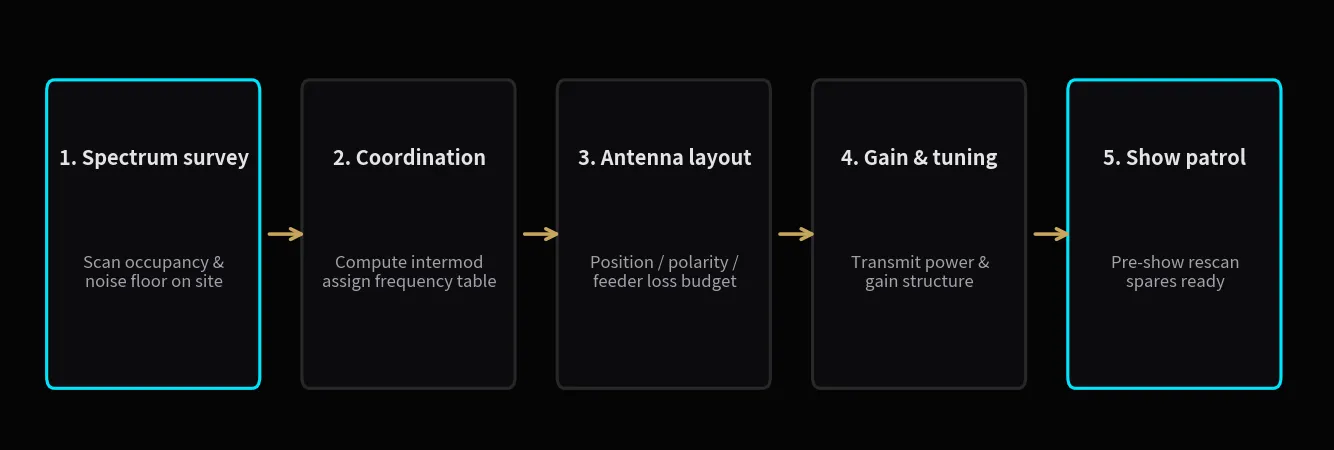
Figure 3
The five-step delivery process: every step has a defined artifact; missing any step means it is not delivered.
The essence of this process is turning "hopefully nothing goes wrong tonight" into "every step is logged and every risk has a plan".
Wireless reliability is planned, not purchased. Survey first, coordinate second, tier the antennas to scale, and walk the five steps to the end — at that granularity, dropouts become other people's stories.